The short answer
Most scores on a school evaluation report are standard scores, where the average is 100 and one step from average is 15 points. Subtest scaled scores run 1 to 19 with an average of 10, T-scores average 50, and a percentile rank says where a child stood among same-age peers. Every score is an estimate.
What the numbers in the table are measuring
The score tables in the middle of the report look like a gradebook. They are not one. No number in them is the percentage of questions your child answered correctly, and none is a letter grade in disguise. Each one answers a narrower question: how far from average, for children the same age, and in which direction.
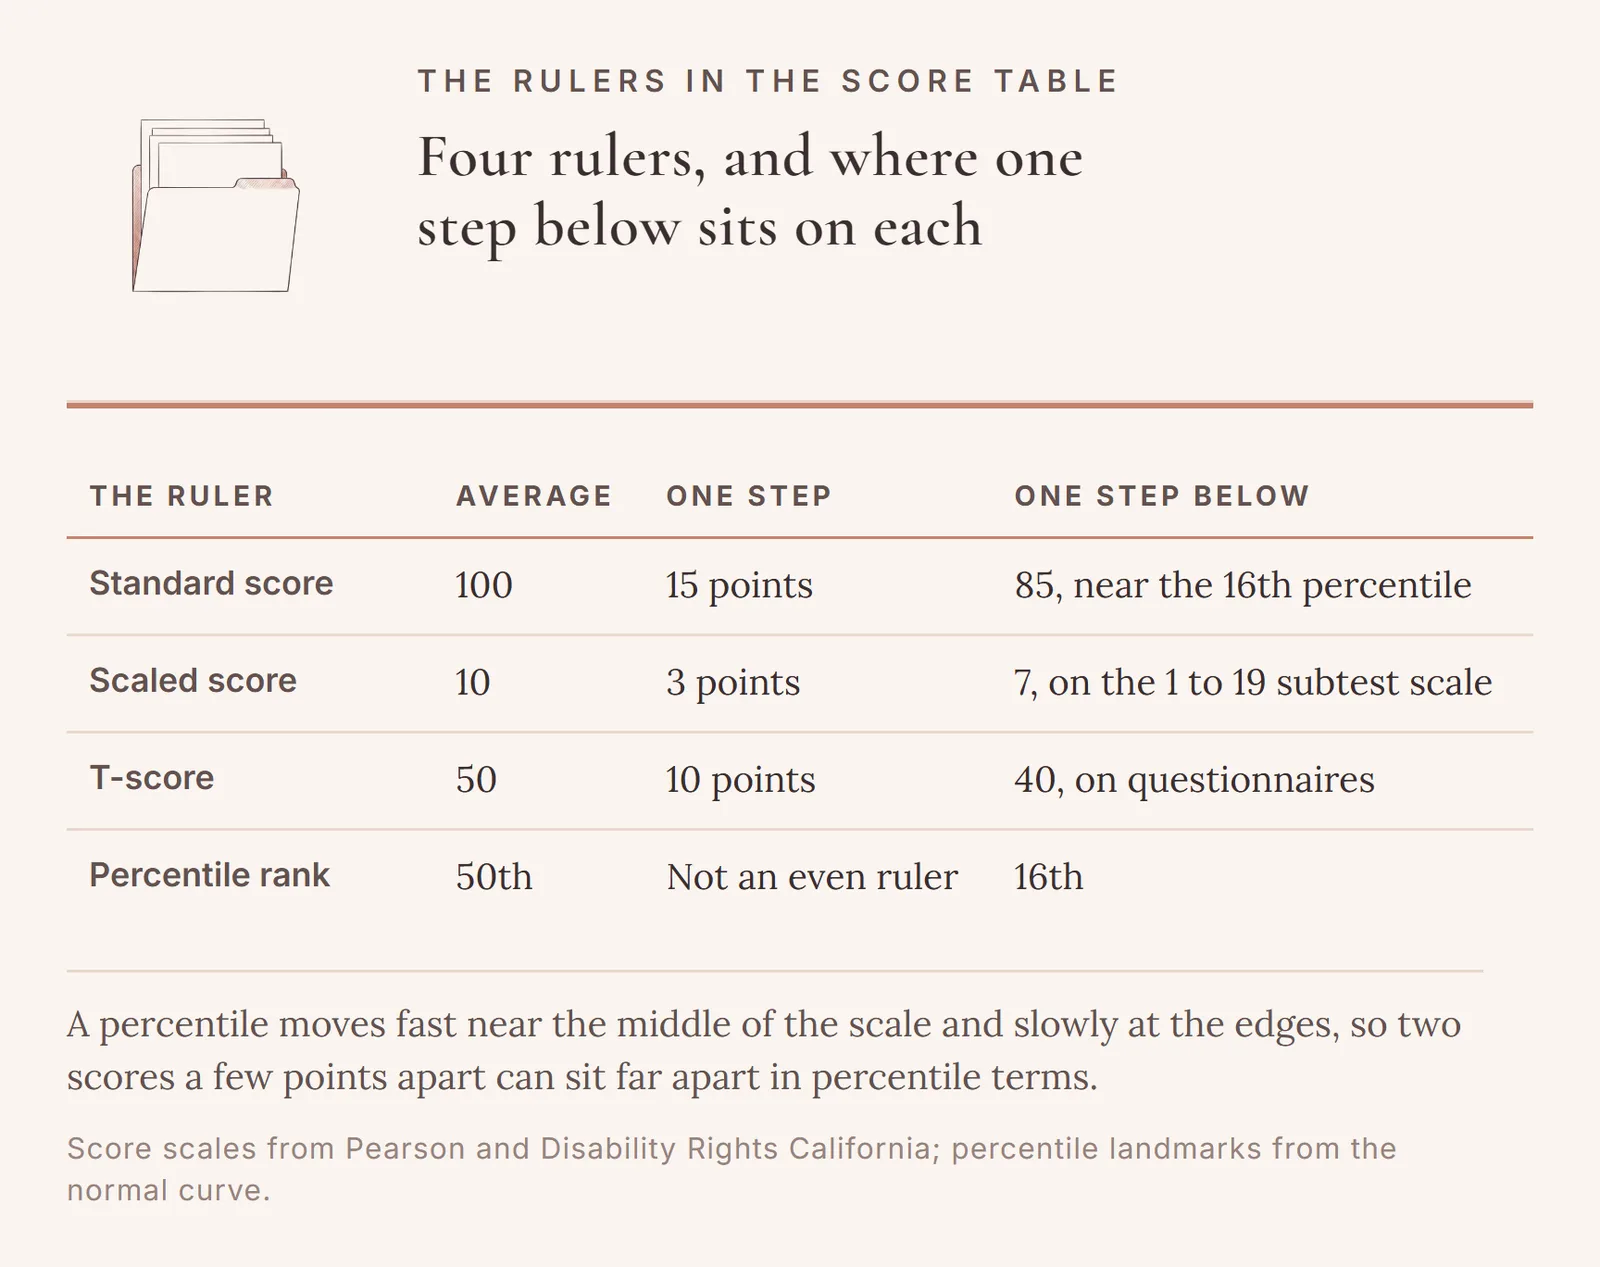
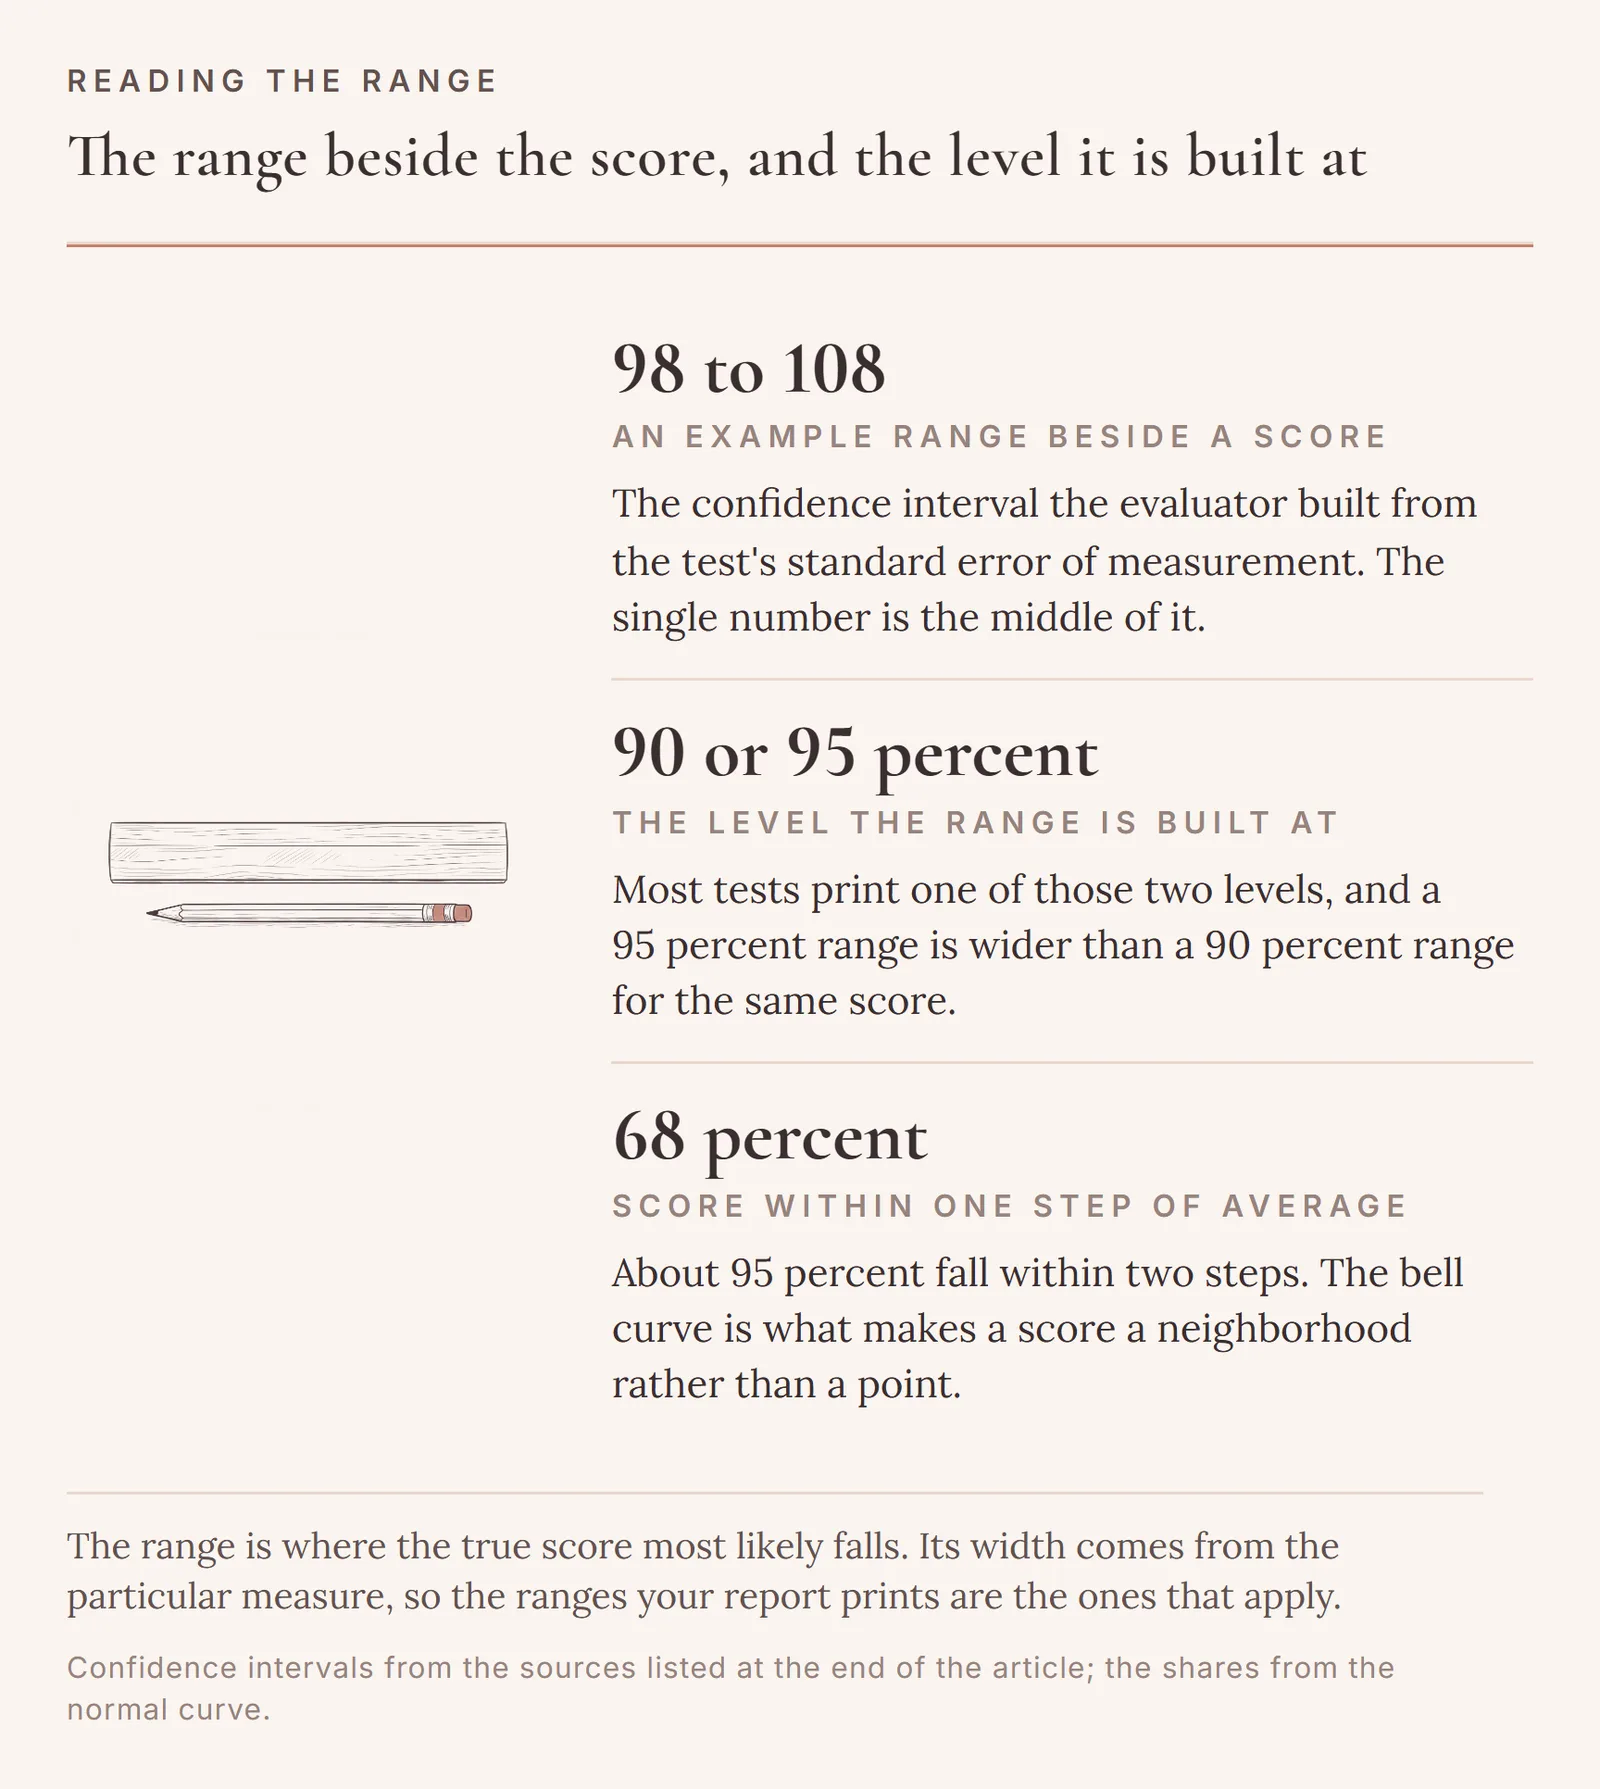
Average here is not a standard your child was asked to meet. Before a test reaches one child, it is given to a large sample of children sorted by age, and the middle of that sample becomes the average. On the bell curve those samples form, about 68 percent of children score within one step of average and about 95 percent within two. That is why 85 sits near the 16th percentile, 100 at the 50th, and 115 near the 84th.
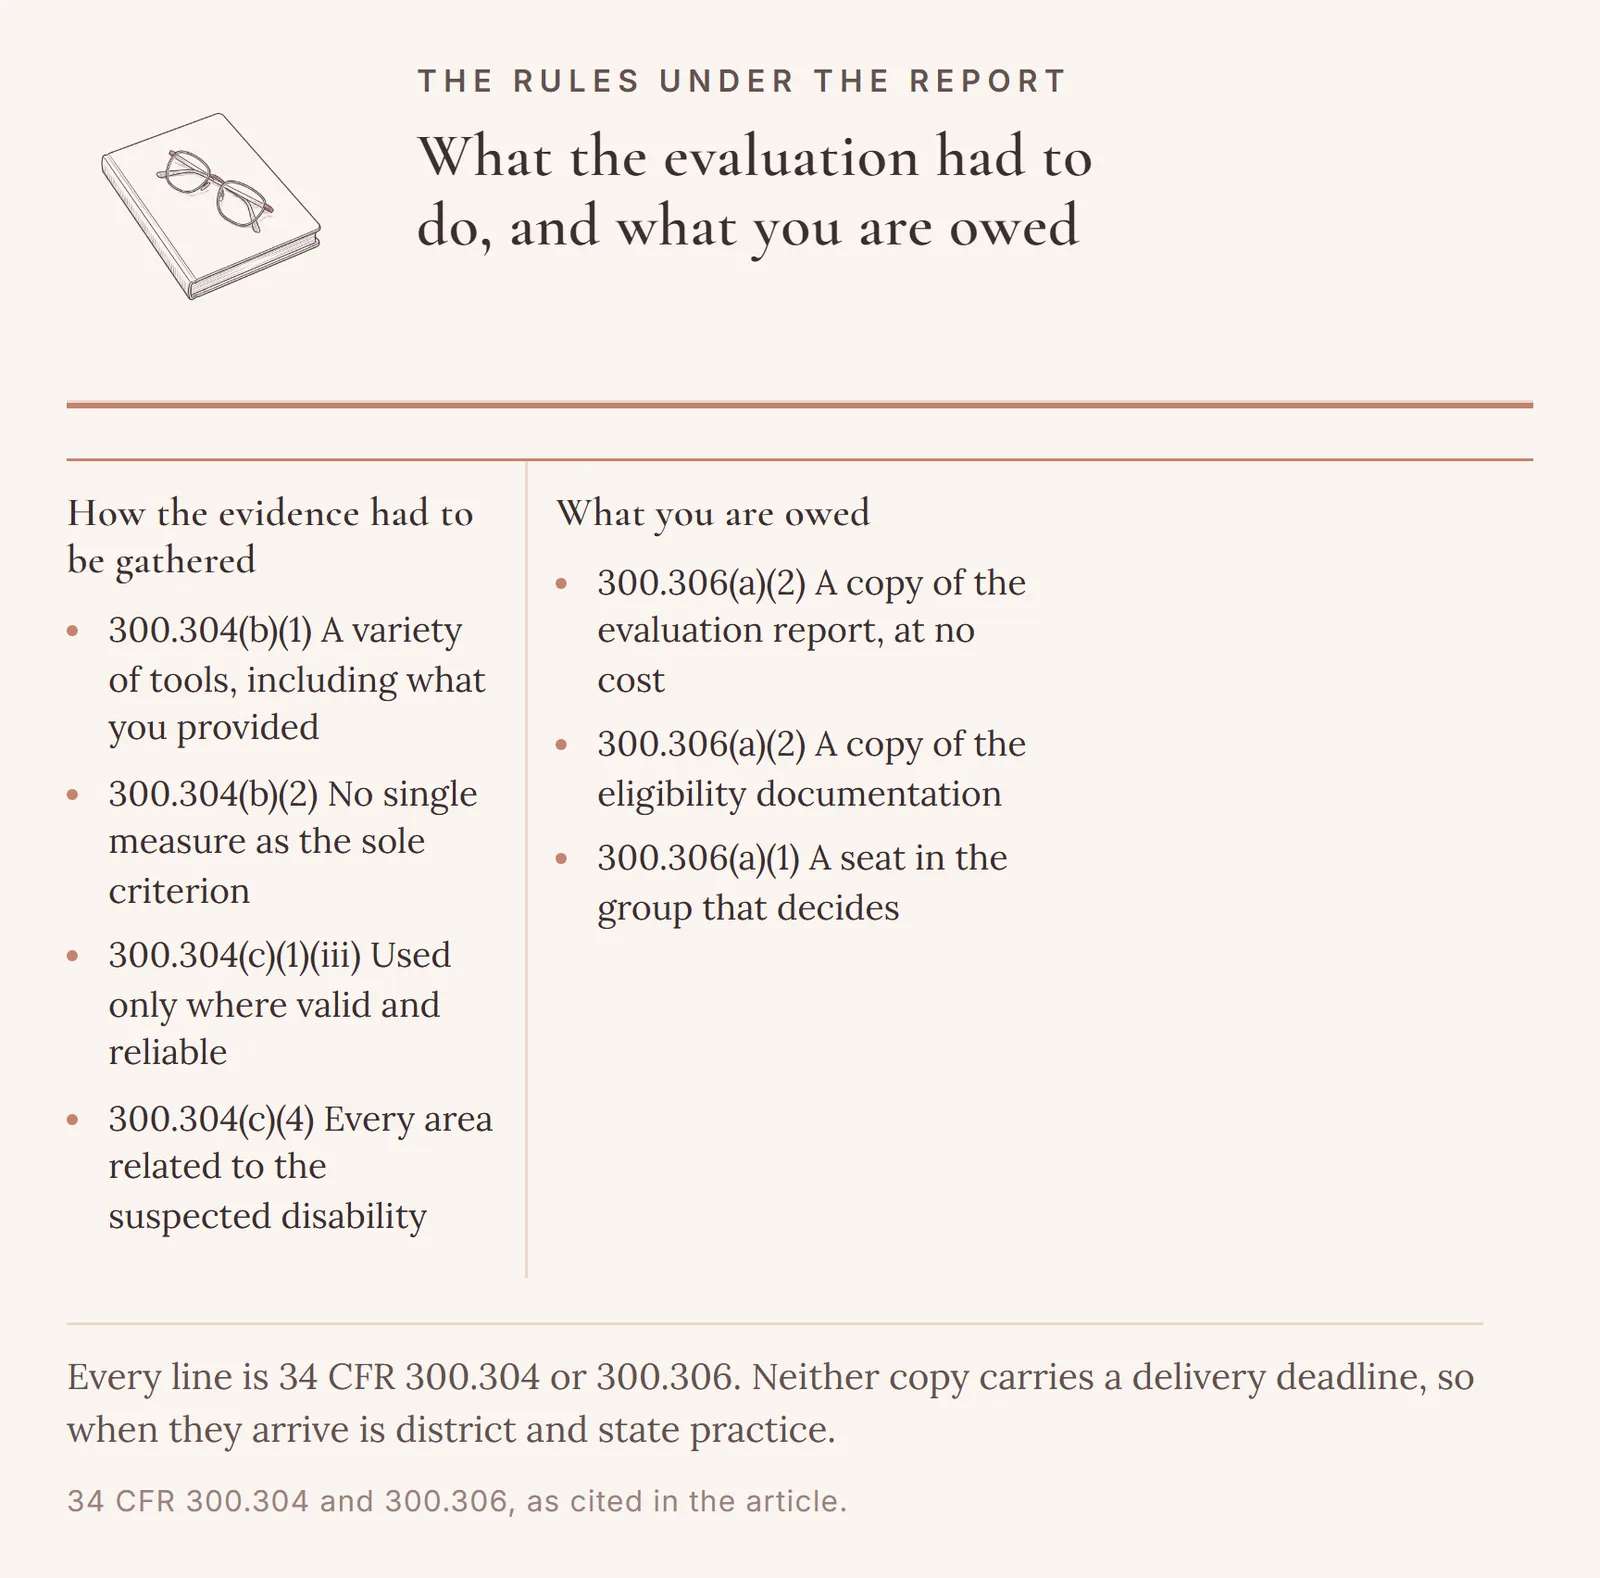
One more thing belongs at the front. The evaluation had to use a variety of assessment tools and strategies, including information you provided (34 CFR 300.304(b)(1)), and it must not use any single measure as the sole criterion for deciding whether a child has a disability or what program is appropriate (34 CFR 300.304(b)(2)). No number on that page decides anything by itself.
How the score families work
Which ruler is this score on
Three rulers do most of the work, and a report drawing on a cognitive test, an achievement test, and a parent questionnaire prints all three on one page.
Standard scores average 100, with 15 points to a step. They carry the overall scores and the subject-area scores: reading, math, written language.
Scaled scores are the subtest ruler on Wechsler-style batteries. They run 1 to 19, the average is 10, and one step is 3 points (Pearson's WISC-V interpretive report sample).
T-scores average 50, with 10 points to a step. They appear on behavior questionnaires such as the BASC-3 and the Conners forms, where a higher score usually means more of the behavior was reported rather than more ability. The form's own key says which direction it runs.
The percentile rank is usually printed beside the score, either in parentheses or in its own column. It says what percentage of same-age children in the test's comparison sample your child equaled or exceeded, and it is not the percentage of items answered correctly (Columbia University's LEADERSproject, on percentile rank and age equivalency).
So a scaled score of 7, a standard score of 85, and a T-score of 40 are the same news on three rulers: one step below average, near the 16th percentile.
Why does the report print a range beside the score
Because every test wobbles. Take the same test again next Tuesday and the number lands a little higher or a little lower, and test makers measure that and publish it as the standard error of measurement. What a report shows is what the evaluator built from it: a confidence interval, a range such as 98 to 108 printed beside the score (LEADERSproject, on standard error and confidence intervals).
Most tests print that range at a 90 percent or a 95 percent confidence level (LEADERSproject, on understanding the confidence interval), and a 95 percent range is wider than a 90 percent range for the same score. The score is the best guess. The range is the neighborhood that guess lives in.
What rules did the evaluation itself have to follow
A few, and they are short enough to hold in your head. Assessments must be used for the purposes for which they are valid and reliable, given by trained and knowledgeable personnel, and administered according to the producer's instructions (34 CFR 300.304(c)(1)(iii)-(v)). The child must be assessed in all areas related to the suspected disability (34 CFR 300.304(c)(4)).
Eligibility, the decision about whether a child qualifies for special education, is made by a group of qualified professionals and the parent of the child (34 CFR 300.306(a)(1)). The parent is named in the regulation. The school district must also give the parent a copy of the evaluation report and a copy of the documentation of determination of eligibility, at no cost (34 CFR 300.306(a)(2)). No delivery deadline is attached to either copy, so when they arrive is district and state practice.
How to read the score table in order
- Find the key first. Most reports print their own classification table, and that key is the one that applies to those scores.
- Label each column by ruler: standard score, scaled score, T-score, percentile.
- Count steps, not points. A 7 on the subtest ruler and an 85 on the standard-score ruler sit the same distance from average. Steps travel between rulers. Points do not.
- Read every score together with its own range, out loud, as one sentence. Two numbers that look far apart can carry ranges that overlap.
- For any age or grade equivalent, find the standard score and percentile it was derived from. Those are the numbers with published ranges.
- Mark the results you want said in everyday words. The specialists who assessed your child will explain what they did and what the scores mean compared with other children (Center for Parent Information and Resources).
Mistakes and edge cases
Reading a T-score with the standard-score ruler. A T-score of 65 is not a low score. On the questionnaire ruler it sits a step and a half above an average of 50, which on most behavior scales means more of the behavior was reported, not less ability.
Treating the label as the finding. Publishers choose their own descriptive words for their own score ranges, and they differ between publishers and between editions, and Pearson publishes its own descriptor table for the WISC-V. The number is comparable across tests built on the same scale. The word is not.
Reading a grade equivalent as a grade level. A grade equivalent of 9.5 means your child's raw score matched the median raw score that ninth-graders in the fifth month of the year earned on the same test content. Pearson's own interpretive guidance says age and grade equivalents should not be used for diagnostic or placement decisions: they are not an interval scale, and their reliability is much poorer for advanced test-takers.
If your disagreement turns out to be with the evaluation itself rather than with its vocabulary, that is a different road with its own rules.
Every state has a free, federally funded Parent Training and Information Center, and sitting with a parent over a score table is ordinary work for them. Find yours at parentcenterhub.org.
FAQ
Is a standard score of 85 a bad score?
It is one step below the average of 100, near the 16th percentile, and that is all it says. It describes where one performance landed on one day, and it cannot be the sole criterion for a decision about disability or program (34 CFR 300.304(b)(2)).
What does a percentile rank actually tell me?
Where your child stood in a line of same-age children from the test's sample: the percentage of them your child equaled or exceeded. A child at the 75th percentile did not necessarily get 75 percent of the items right.
Why do two reports use different words for the same number?
Because the descriptive labels belong to each publisher and each edition, not to the industry. Two tests built on the standard-score scale can be compared as numbers. The words attached to them cannot.
Sources
- eCFR, 34 CFR 300.304, evaluations (https://www.ecfr.gov/current/title-34/section-300.304)
- eCFR, 34 CFR 300.306, eligibility (https://www.ecfr.gov/current/title-34/section-300.306)
- Center for Parent Information and Resources, Evaluating Children for Disability (https://www.parentcenterhub.org/evaluation/)
- Center for Parent Information and Resources, state Parent Training and Information Centers (https://www.parentcenterhub.org/find-your-center/)
- Disability Rights California, Understanding Psycho-Educational Evaluations, the score scales (https://www.disabilityrightsca.org/publications/understanding-psycho-educational-evaluations)
- Pearson Assessments, WISC-V interpretive report sample, the subtest and composite metrics and the qualitative descriptions (https://www.pearsonassessments.com/content/dam/school/global/clinical/us/assets/wisc-v/wisc-v-interpretive-report.pdf)
- Pearson Assessments, Interpretation Problems of Age and Grade Equivalents (https://www.pearsonassessments.com/campaign/interpretation-problems-of-age-and-grade-equivalents.html)
- Columbia University LEADERSproject, standard error and confidence intervals (https://edblogs.columbia.edu/leadersproject1/2013/06/07/preschool-disability-evaluations-module-10-standard-error-of-measurement-and-confidence-intervals/)
- Columbia University LEADERSproject, understanding the confidence interval (https://edblogs.columbia.edu/leadersproject1/2013/03/01/the-importance-of-understanding-the-confidence-interval/)
- Columbia University LEADERSproject, percentile rank and age equivalency (https://edblogs.columbia.edu/leadersproject1/2013/03/01/problems-with-percentile-rank-and-age-equivalency/)